Contact us!
 +49 (0)40 4210 475 0 info@compensation-partner.de

Contact us!
 +49 (0)40 4210 475 0 info@compensation-partner.de


Compensation-Online. Our HR-Tool for Compensation Related Questions

Supports Your HR Management

when negotiating salaries:
Arguing with facts instead of opinions

recruiting:
Determine and justify common market budgets for any job

job grading system integration:
Our job grading system is able to replicate almost any system which you may use

competent Support:
We are ready to support you in all questions regarding Compensation-Online and salary benchmarks

Supports Your Management

general decisions about personnel costs:
Needs for action forced by structural overpayments or underpayments become clear at a glance

market comparison of the entire company:
The Management Summary shows at a glance how the remuneration level of the entire company relates to the competition

Supports Your Safety

broad database:
Approx. 250,000 current data sets are includes into our calculations at a time  facts instead of just a feeling

tailored to your specific needs:
Using 24 relevant parameters, compensation analyses can be tailored to the specific information needs of your company, e.g. with regard to your region (in Germany), your company size, your industry and many more!

over 400 satisfied customers:
For over 10 years on the market many hundreds of customers appreciate our results - including most likely your competitors

Is a Modest Investment

prices:
Attractive and competitive conditions depending on company size and desired product package – ask us for details

return on investment:
If Compensation-Online is able to avoid an overpayment of 10% e.g. when recruiting a department head, the investment will usually have paid off in a single instance

Instant Salary Benchmarks – Job Grading

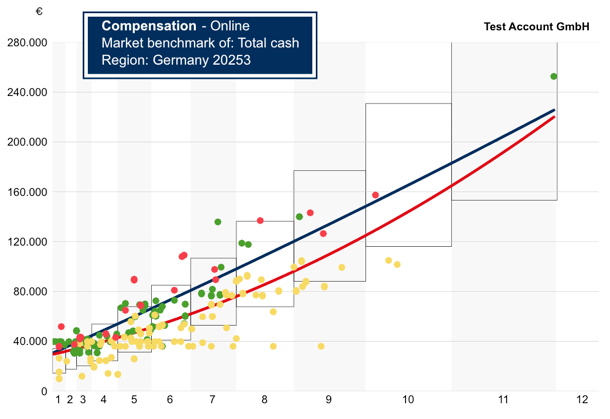
Our integrated compensation platform provides transparency regarding common market compensation and thus enables our clients to monitor labor costs as well as recruit and retain employees.

Salary Benchmarks

„What is the standard market salary for position XY?“

transparency provided regarding
  • base salary
  • overtime Compensation
  • variable Compensation
  • total cash Compensation
  • corporate Pension Scheme
  • company Car
data base
  • At all time min. 250,000 current data sets present
24 relevant parameter:
  • more than 200 job families
  • more than 50 industries
  • company size
  • education (knowlegde)
  • experience (ability)
  • communication skills, strategic impact, psychic and physical requirements

Job Grading

„How important is the position XY in my company? „What is its value?“

  • our Job evaluation system was developed and designed for online use:
  • based on easy to answer questions it is
  • simple to understand, comprenhensible and user friendly.
  • it integrates salary bands based on market data
  • it is an open system and able to map your existing job evaluation system. With any job evaluation performed on our platform you will get the relevant job grade in your system.
  • Using our Management Summary you compare the compensation characterstic of your company with your relevant market based on a consistend job evaluation system

All Relevant Information for Top Management

Dots And Curves

Current salaries compared to market salaries incl. color coding (too high wage, too low wage, meeting market values) and pay scale on the Y-axis Job evaluation value on the X-axis, values range from gate keeper to the board

Based on your compensation / grading information we develeop your company compensation curve in red = your pay depending on the grading level. We add in blue: the market compensation curve = market pay depending on the grading level – in your branch, your region and your company size

The comparison of the curves and the individual data can immediately show strategically important fields of action in the remuneration. In this example, you read:

  1. dangerous remuneration situation in general – high costs in low grades and low salaries in high grades.
  2. too low salaries in the management level – at the risk of loss of important leaders.
  3. some outliers with very high salaries marked as red dots - too high costs?
  4. quite many salaries below the lower quartile marked as yellow dots (= 75% of people in the market earn higher salaries).

You can retrieve these results for your entire company, for single departments or for single hierarchy levels - the market curve always reflects the relevant market to the selection made.